Herd Immunity
A story
Imagine that there is a 100% effective vaccine for something contagious. Everyone in town has gotten the vaccine except you. If you never leave town and no one new comes into town, how would you ever catch that disease? You wouldn't.
Now imagine that a new unvaccinated person flies into town who caught that disease on their travels. You might now come into contact with them and your chances of getting sick just went up. And the more unvaccinated people who fly in who might have the disease, the higher your chances are. For unprotected people, their odds of getting the disease change depending on how many people around them are vaccinated. This is the strange but true world of herd immunity.
How diseases spread
Disease Spread
Total People Sick
These graphs simulate how many people get sick in a town of 100,000 people in different vaccination and disease scenarios(1). The bottom graphs are just zoomed-in versions of the top because sometimes it is hard to see what is happening in the full graphs. The left graphs show how many people have had the disease, the light green "no herd immunity" line showing what would happen if vaccination rates did not affect the spread(2) and the dark green showing what happens when some of the people you meet every day are vaccinated and "dilute" your ability to spread disease. These graphs always rise to some sort of plateau (the maximum number of people infected) and the right-hand graphs show what this plateau would be as more people get vaccinated.
The curves are affected by the disease and vaccine characteristics and these values can be changed in the simulation using the controls above the graphs:
- The vaccine efficacy tells you how many people actually become immune for every 100 people vaccinated. Vaccines do not always work perfectly. A 100% effective vaccine would mean no vaccinated person gets the disease. A 0% effective vaccine means you are equally likely to catch the disease whether you are vaccinated or unvaccinated.
- The vaccine coverage tells you how many of every 100 people in the population are vaccinated. This number will always be less than 100% because there will always be some unvaccinated people. Some children are too young to be vaccinated; some people are immune-compromised or have conditions that prevent them from being vaccinated. The right graphs show the total number of infected people over a range of coverages, but there is a vertical line corresponding to the coverage in this box and the numbers where the green lines cross this vertical line should correspond to the plateau values in the left graphs.
- The serial interval is the period of time over which you can spread the disease to other people after you catch the disease. Changing this stretches or squeezes the graph horizontally, affecting how long it takes for the outbreak to peak.
- R0 is the "basic reproduction number" which tells you how many people each sick person would spread the disease to during the time they are contagious in a completely unprotected population. For ebola, this number is around 2 (pretty low). For measles, it is around 15 (very high). But there can be some variation even for a particular disease depending on whether you live in a crowded city, whether people stay home from work when they're sick, if there are good public health quarantining procedures and other factors(3).
What is an outbreak?
These graphs demonstrate how vaccine coverage affects the spread of disease and the total number of people infected. Take one of the fastest-spreading diseases: measles. Two doses of the measles vaccine are about 99% effective; it has a serial interval of 10 days and an R0 of around 15 (every infected person spreads the disease to about 15 people in a non-immune population). If you enter these numbers, the top-right graph will show light and dark green lines that nearly overlap until a vaccine coverage of about 80%. Beyond this, there are differences, emphasized in the bottom-right graph.
Use the above settings (Efficacy=99, R0=15, Serial Interval=10), and set the coverage to 0%. The left graphs show the lines increasing for a few weeks, and then taking off until all 100,000 people in town are sick, a process that takes about 7 weeks. This is, of course, an outbreak of disease. But what might be surprising is that you can increase the vaccine coverage a lot and things do not improve much. If you increase the coverage through 30%, 50% and 70% of people, the total number of people who end up getting sick decreases, but this is because almost all of those who were vaccinated (99% of them) do not get sick. Everyone who is unvaccinated still gets sick (and 1% of those vaccinated as well), which is why the light and dark green lines hit the same plateau(4). You have to go up to 85% vaccine coverage before you start seeing any difference between the light and dark green lines. But there is still rapid spread of disease that, by most definitions, would be termed an outbreak.
What is not an outbreak?
Set the vaccine coverage to 99%. For the dark green line, only 1 person gets sick. This might not seem so surprising at first because the whole point of vaccines is that they are supposed to stop people from getting sick and this simulation assumes a very effective vaccine that works 99% of the time. But take a minute to think about how many people are unprotected. In a town of 100,000 people with 99% vaccine coverage, 1% of 100,000 or 1000 people are unvaccinated. An additional 990 people got vaccinated but the vaccine was ineffective (1% failure of the vaccine for the 99,000 vaccinated people). This makes a total of 1990 people, which is where the light green line plateaus because it assumes that your chance of getting the disease is the same regardless of the number of immune people (so for a disease that spreads this fast, with R0=15, all unprotected people get sick eventually). And back when the vaccine coverage was low, at 0%, 50% or even 70%, this was also the case; all of the non-immune people were getting sick even with this "herd immunity" calculation. But now only 1 out of 1990 non-immune people gets sick. What is that about?
Basically, one sick person wandering around is not going to meet all 100,000 people in town during the time that they are contagious. They might come into close contact with 10 or 15 people (maybe more depending on what their job is, how they commute, what they do socially and how long they are sick for). If you like math, when an infected person meets someone, the chance that single person is not immune is 1990 out of 100,000 or about 1.99%. For 10 different people, the chance that at least 1 of those 10 will not be immune and could continue to spread the disease is 18%(5). This is not astromonically unlikely, but it is more likely that all 10 people met will be immune than that 1 of them could catch and continue to transmit the disease, so the disease spread is likely to be interrupted. This prevents an outbreak.
How can an outbreak be stopped?
Looking at extreme situations can only teach us so much. What is more interesting and perhaps surprising is how wrong our expectations might be in the in-between situations. At 99% coverage, 1 person was sick (only look at the dark green "herd immunity" line for the moment). Drop this to 98% coverage. Now 2 people get sick. At 97%? Still 2 people. At 96%, 4 people. So going from 99% coverage to 96% coverage, the total number of people who got sick went from 1 to 4. Roughly how many people do you think would get sick if the coverage drops 3 more percentage points to 93%. Take a moment to think before changing the number.
My first instinct was that at 93% coverage, we might see something like 7 or 8 people sick, but if you set the coverage to 93%, you will see that 2458 people get sick(6). To put is another way, a 3% decrease in vaccination rate, results in a 61,350% increase in the number of people getting sick. Why? The reason is that when you get vaccinated (and it is effective), you don't just stop yourself from getting sick; you also prevent other people from getting sick because you don't spread the disease to them. It is a little extra "bonus" protection for the non-immune that goes beyond the vaccinated person. This is herd immunity. This is what is missing in the disease risk calculation when it assumes that the chances of getting sick do not vary depending on how much of the population is vaccinated. They will for any disease that is transmitted person-to-person.
And herd immunity can mean that we underestimate how close we are to the risk of an outbreak. In the case above, at 96% coverage, 4 people get sick; at 93% coverage 2458 people get sick. This is really the key to understanding a lot of the arguing about how effective vaccines are. It is not that there are no studies of vaccine efficacy or that the studies that have been done are flawed or that disease risks are exaggerated; it is that the situation exists near this very unstable point between when an outbreak is contained versus when it is not.
This is why anti-vaccination people think that doctors are “scaremongerers”. Four people out of 100,000 getting sick is not that many, so is it really necessary to be so insistent about vaccination? The doctors must be lying, they conclude. But in reality, doctors understand how outbreaks happen and they know that if vaccine coverage gets low enough, then they will suddenly have thousands of cases to deal with instead of a handful. And these doctors will know that it might have been stopped if they could have just convinced a few more people to vaccinate. That could have made the difference. It is not some profit-driven or power-mad need to scaremonger that lead doctors to insist vaccination is important; it is graphs like this. It is the knowledge of what happens if everything falls apart.
Some additional herd immunity math
How many people really need to be vaccinated to see this herd immunity effect? Different diseases are different and if you play around with the R0 and efficacy numbers in the graphs, you will notice that the real drop in infected people occurs at different vaccine coverage levels. There is some math that can be used to work this out (if you would rather just use the graphs or avoid math, you can skip this section; it is not necessary for understanding the basic concepts).
If no one ever became immune, then most diseases would spread with what's called exponential growth. That means, for an R0 of 15, the first person gets 15 people sick. Then each of those gets 15 people sick, which is 15*15 = 225 people. Then each of those 225 spreads the disease to 15 more people and so on. The total number of sick people is 1 + 15 + 15*15 + 15*15*15 +... which is a geometric series and the total number of sick people will be infinite (or everyone in town for a finite-sized town).
But one property about geometric series is that if the number you keep multiplying by (R0=15 here) is less than 1, then the series "converges" and not everyone gets sick. You can see this if you set the coverage to 0, but set R0=0.5. Now only two people get sick even though no one is vaccinated. This is because a disease with R0=0.5 is not very contagious. I noted above that ebola has an R0 of about 2, which generally would mean an outbreak, but when a single case showed up in the US or Spain, it only spread to a few people without an outbreak taking off in those regions. The reason that ebola could be contained, even without a vaccine, is that its R0 is so low that, once you are aware of the disease, you can start looking for people with symptoms, get them into quarantine, make sure people who deal with them wear protective equipment and undergo decontamination procedures to prevent spread, and you can get the R0 to effectively be less than 1.(7)
But to get from R0 of 15 to something less than 1 is not likely to be possible simply with protective equipment and quarantine procedures. Vaccines offer a way to lower the effective rate of spread. For example, if about half of people are effectively vaccinated, then rather than spreading the disease to 15 people, each person will only spread it to about half that. In math terms, this looks like Reff=(1-efficacy*coverage)(R0) and for a geometric series to converge, you want Reff < 1 or (1-1/R0)/efficacy < coverage. For a 99% effective vaccine and R0=15, that means a vaccine coverage of about 94% is needed to achieve herd immunity. And that is why is is between 95% and 93% coverage that you see the total number of infected people start to increase rapidly in the graphs below.
This means that every disease has a different coverage needed to achieve herd immunity: the diseases spread at different rates and the vaccines have different efficacies. Measles is a particularly dramatic example because an R0 around 15 indicates a highly contagious disease, meaning a vaccine must have high efficacy and high coverage to provide herd immunity. And the high efficacy of two doses of the vaccine mean that every person who doesn't get the vaccine increases the chances of spread much more than with a less effective vaccine, so even a 1% decrease in coverage can produce very dramatic effects near the herd immunity threshold.
One other way to think about the changes near the herd immunity threshold is in terms of the likelihood of contacting a non-immune person (and thus passing the disease on). Consider the case above (Efficacy=99, R0=15, Serial Interval=10) and think about an infected person walking around and meeting 10 people during the time they are contagious. At 96% coverage, the chances that at least 1 of these 10 people will not be immune and could get infected and continue spreading the disease is about 40%(8). With 93% vaccine coverage, the chance that at least 1 of those 10 people is unvaccinated is about 56%(9). This may not seem much higher, but it puts the probability of spreading the disease to at least one person above 50%, meaning that it is more likely than not to pass the disease on and that is what produces outbreaks.
One final point that is less math and more terminology: sometimes anti-vaccination blogs will claim that herd immunity can't be real because there are outbreaks of disease or because vaccinated people get sick. This seems to be a confusion of true biological immunity with "herd immunity". Herd immunity is not a 100% guarantee that you will not get sick if you are not vaccinated (as we saw with the above graphs at 94% coverage and above). It does not even mean that you won't get sick if you are vaccinated (because vaccine efficacy is less than 100%). It simply means that an outbreak will be contained relatively quickly and spread will be limited.
Someone always could bring the disease in and put people at risk because herd immunity is not true biological immunity (if you are unvaccinated but protected by herd immunity and go to a country with high incidence rates you are not somehow magically going to carry your herd immunity with you, which is why unprotected people travelling to regions with outbreaks keep bringing measles back to the US). But herd immunity means that your probability of getting sick, whether you are vaccinated or unvaccinated, is lower because you are less likely to catch the disease.
Delaying vaccination
Some out there on the Internet have suggested that vaccination should be delayed. There are many factors that go into deciding the vaccine schedule, including the ages and spacings at which vaccines are most effective and safe, what tends to produce good vaccine coverage (adults are much less likely to show up for doctors' appointments) and the prevalence of the disease(10). Herd immunity also plays into this decision because the later that a vaccine is scheduled, the larger the proportion of the population that will not have protection. In fact, you often see in outbreaks of measles or pertussis that a large proportion of those who get sick are children who were too young to be vaccinated, but they caught the disease when there was an outbreak.
Intentionally delaying vaccines might feel safer, but if many parents choose to delay, there is actually large potential for danger. For example, there were roughly 20 million children under the age of 4 out of 320 million people in the US in 2015. This is about 6.3% of the population, so if everyone delayed vaccination until the age of 4, the US would already be on the herd immunity threshold for measles before even counting all of the people who cannot be vaccinated for other reasons. And it would not require all parents in the US to delay for problems to start: those who believe there is some advantage to not vaccinating or delaying vaccination often are part of groups of parents encouraging each other to do likewise, sometimes for religious reasons, sometimes because of Internet blogs getting shared around. This means that unvaccinated children often spend more time with other unvaccinated children and outbreaks can spread very quickly if an infection enters the group. For example, here is a study of a 2007 measles outbreak in Quebec that spread through a population that was 95% immune, but where the disease got into several unvaccinated clusters because unvaccinated people attended alternative schools with low (<50%) vaccine coverage or went to the theatre with other unvaccinated friends.
Evidence for herd immunity in the real world
Some of those against vaccination try to claim that herd immunity does not exist or is some mystical phenomenon designed to scare or guilt people into vaccinating. It is not mystical. If you understand that infectious disease are transmitted from one person to another and you understand that people can be immune to a disease and thus do not get sick and therefore will not spread the disease to others, then you understand the way that herd immunity works. It simply means that when there are enough immune people around (and they can be immune either from vaccination or from previously having had the disease), some of the people that a contagious person runs into are immune and this interrupts the spread of the disease.
But it always good to question things, even when they seem like common sense (especially those things actually), so here are a few examples.
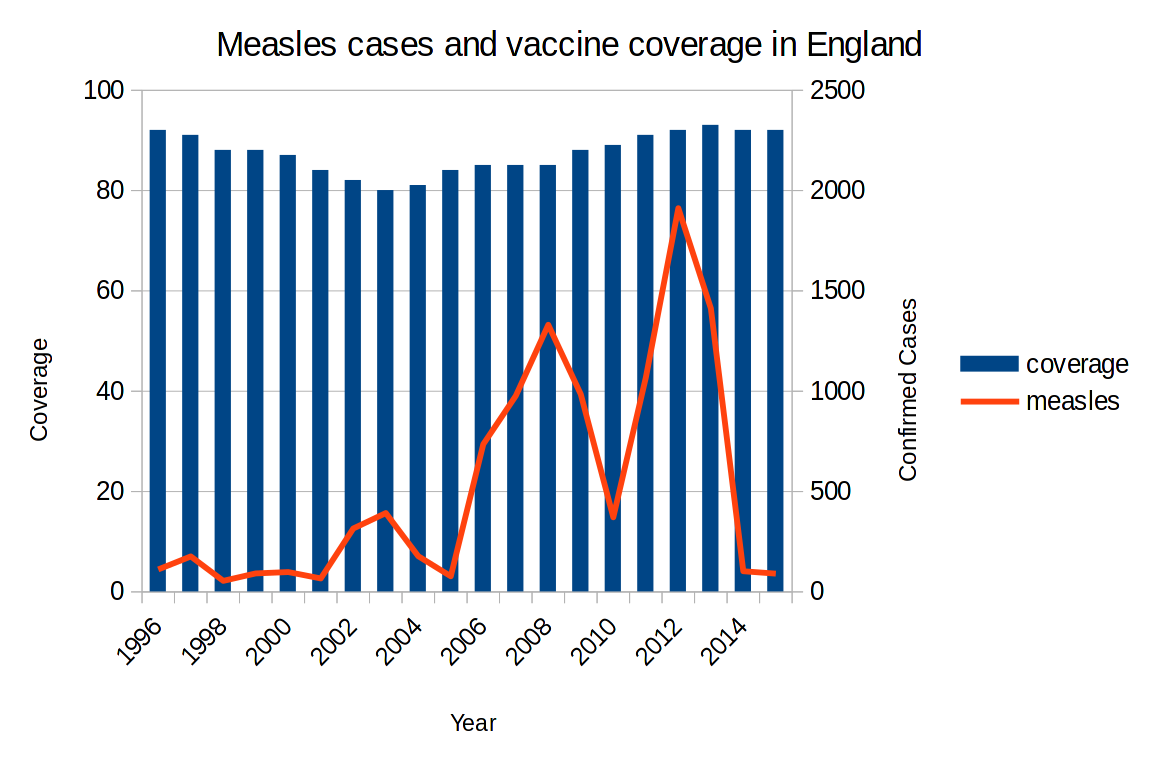
Here is a graph of measles cases in England(11) when the vaccine coverage dropped. There are peaks and valleys because measles has natural waves globally and when global cases are high, the chances of importing a case are higher. The peaks start appearing shortly after the coverage drops. But what is noteworthy is that vaccine coverage falls what appears to be a fairly small amount, from 92% to 80%, but the number of cases skyrocketed, from around 100 to nearly 2000. And then, once coverage passes the herd immunity level again, cases fall back down again.
If you are curious as to why coverage fell, 1998 was the year that a later-retracted study hypothesizing a link between the MMR vaccine, bowel disease and autism was published and took off in the media(12).
This section is still under construction. Data to be added include:
- data from this paper on the decrease in pertussis vaccine coverage in some countries and the return of the disease in those countries.
- data from Mali and Burkina Faso where vaccine coverage went from 33-37% to about 95% in a year and reported cases dropped by more than 90%.
- the regions that maintained no or very low numbers of measles cases in spite of being surrounded by regions in outbreak in this data from the Netherlands and the near exact inverse correlation with vaccine coverage. And the difference in coverage is what might be considered small: some regions with 91-95% coverage had over 500 cases, while nearby regions with over 95% coverage had 0 cases.
- In this study of an outbreak at a Singapore primary school, the vaccination coverage in classes where the outbreak spread was 93% whereas the coverage in classes without measles cases was 96%.
Final comments
Sometimes the low incidence of diseases that we vaccinate for is listed as evidence that we could get rid of those vaccines. This ignores that vaccines are responsible for current low rates of disease. This includes the low disease rates amongst the unvaccinated in many developed countries because those people will be protected by herd immunity provided they don't travel to regions with high incidence. Indeed, it was arguments like these that led to suggestions that DTP vaccination could be dispensed with and resulted in pertussis outbreaks, presented in the Evidence section above.
It is something like if you increased the numbers of police, noticed that there was less crime and then decided that you could get rid of the police force. It presumes that there is no current relationship between two things that we know have historically been related. The police aren't perfect at preventing crimes, just like vaccines aren't perfect at preventing diseases, but past evidence shows that decreasing vaccine coverage increases disease incidence and vice versa.
What's next?
Now you know how herd immunity works and how big an effect it has in different cases. That is as far as we're going to look into the question of how vaccines change the rates of the diseases they protect against, but this still doesn't answer all of the questions about risk because we haven't talked about the downsides of vaccines. To get a full picture, we now need to look at the risks of getting vaccinated.
Footnotes
- As "simulate" implies, creating such graphs involves assumptions. The calculations are done in javascript, so you can see the details yourself by viewing the page source (usually available as one of the options when you right-click on the webpage). Briefly, the simulations assume that:
(1) People who have been vaccinated effectively or get sick become immune for life.
(2) Everyone knows a representative selection of the population. So if 80% of the population have been vaccinated, then 80% of the people one encounters in a day will be vaccinated. In reality, unvaccinated people are often members of the same social groups and have more contact with one another. Thus "with herd immunity" means that if the average person spreads the disease to about 10 people in an unvaccinated population, then in a population where 80% are immune (by vaccination or having previously caught the disease), 8 of those 10 people will be protected and only 2 will get sick and go on to potentially infect more people. "Without herd immunity" means that the vaccination rate has no influence on the number of people each sick person spreads the disease to.
(3) After one infected person comes into town on day 0, no one new comes into town and none of the 100,000 initially there leave or go to get vaccinated. No one dies during the infection period and no new children are born. This is an isolated, immortal, infertile little town save for that one initial person who brought the infection in.
(4)The simulation uses continuous distributions, meaning it allows things like 100.5 people to get sick. Obviously half a person can't get sick, but the basic concept holds up regardless.
- If you are familiar with math functions, this is just an exponential curve until everyone who is unvaccinated is sick, at which point it is a flat line the rest of the way across the graph. This differs from the herd immunity assumption, which can look similar when there is low efficacy/coverage, but has more of an "S" shape at higher efficacy/coverage.
- However, it is worth noting that staying home, wearing protective equipment and quarantining require people to know that they are sick. For diseases like measles and chicken pox, people are often contagious before showing symptoms like rashes. For other diseases, such as tuberculosis, it is possible to be an "asymptomatic carrier", where you can spread the disease to others without ever having symptoms yourself. Vaccines are intended to prevent you from getting sick and therefore work just as well regardless of whether the people around you know they are sick. For the type of vigilance and effort it takes to reduce and eradicate a disease without the help of a vaccine, check out the Guinea Worm Eradication campaign.
- although at around 45% coverage, it does start taking longer for the dark green line to hit the plateau, 7 weeks in the absence of herd immunity versus 8.5 weeks with it, which would give public health officials more time to respond
- The probability that the first person you meet is immune is (100,000-1990)/100,000 or about 98%. The probability for the second person is 98%. And so on. The probability that all 10 people you meet are immune is 0.9810 and therefore the probability that at least one person is unvaccinated is 1-0.9810 = 0.18 or 18%.
- This is still fewer than the total number of unprotected people though, shown by the plateau of the light green line. Seven percent of people are not vaccinated and 7% of 100,000 = 7000. Of the remaining 93,000 vaccinated people, the vaccine failed in 1% of them = 930 people. 7000 + 930 = 7930.
- Some of the reasons the outbreak spread in Africa include that the outbreak was caught quite late, so many people in multiple countries were already sick and it had hit some larger cities. Also the disease occurred in regions where monitoring was difficult and there were fewer resources per infected individual to handle the outbreak.
This also shows how one of the assumptions of the model fails: it assumes that sick people run into a random selection of the population and no one leaves town or goes to get vaccinated, but in fact these are exactly the sort of behaviours that disease outbreaks produce (because they work!). For minor diseases, when you hear people coughing and sneezing around you, you might change your behaviour and try to avoid them or wash your hands more. And hopefully sick people will stay home from work once they realise they are sick; this is a sort of self-imposed informal version of a quarantine. In the days of the bubonic plague, people who could afford it moved out to the country, abandoning the crowded cities and the infected people within them. These sorts of behavioural changes are not accounted for in the model (although you can lower R to approximate them). - There are 4000 people unvaccinated and 960 people where the vaccine was ineffective, meaning the probability that a single person you meet will be immune is (100,000-4960)/100,000 or 95%. The probability that all 10 people you meet are vaccinated is 0.9510, so the probability that at least one person is unvaccinated is 1-0.9510 = 0.40 or 40%.
- There are 7000 people unvaccinated and 930 where vaccination was ineffective, making the chances of a person you encounter being immune (100,000-7930)/100,000=92%. And for 10 people, the chances that at least one is not immune are 1-0.9210 = 0.56. It is also worth noting in this case that you are more likely to spread the disease to more people. I have shown the calculations for spreading to at least one person, but, for example, the chances of encountering 2 unvaccinated people when you meet 10 in a 96% coverage scenario is 7%, whereas for 93% coverage, this number is 15%
- In countries where measles incidence is higher, vaccinations may be given from 6 months of age, including for children from other countries who travel there. However, the vaccine is generally less effective long-term when given between 6 and 12 months, so it is preferred to give the vaccine later in places where the risk of disease is lower, but not so late that coverage drops too low. All of which only emphasizes how many interconnecting factors need to be considered when designing a vaccine schedule.
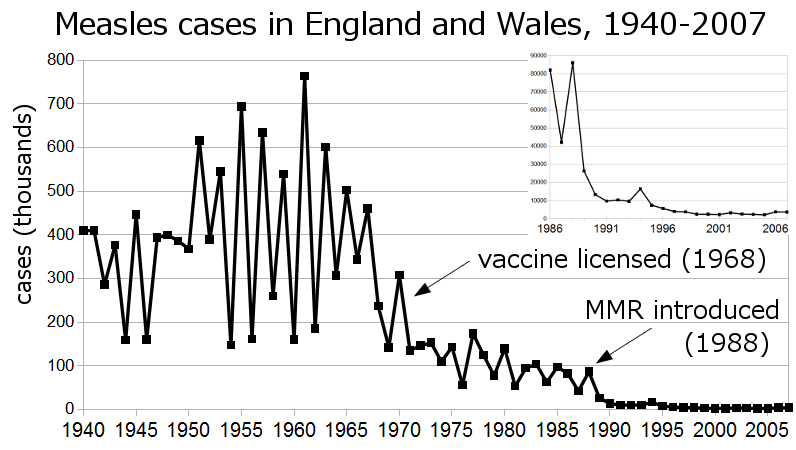
- England changed the location of its data around 2012, so pre-2012 coverage numbers are from here and cases are here. Post-2012 coverage here and cases here. To give the numbers more context, you can see this graph of measles cases from times that pre-date vaccines to see that even 80% coverage is enough to prevent the large numbers of cases that used to occur.
- If you are curious about mumps and rubella, the data show similar waves, but it is not as easy to establish a baseline because mumps was not part of the UK vaccine schedule until 1988 and rubella was only given to girls prior to MMR becoming available. Indeed, a large 2004-2005 mumps outbreak in the UK occurred in children 15-24 who had not been part of a routine mumps vaccination cohort, rather than being attributed to the MMR scare.